Knowing what happens in a motor
Why has a motor repeatedly failed? How can an extremely high system availability be guaranteed? How can you prevent motor bearing damage in hard-to-reach locations?
These are questions that many machine manufacturers and service companies have certainly asked themselves more than once. Particularly when the conditions are challenging, cause-orientated measures are required. The DiffDi® diagnostic system makes it quick and easy to record, analyze and evaluate high-frequency residual currents and their effects on inverter-driven motors.

DiffDi®
System for differential current diagnosis
- Differential current diagnosis on frequency-controlled drives
- Investigation of high-frequency currents and their effects on the motor (motor damage due to bearing currents)
- Measuring range 1 A to 400 A
- Before and after measurement in 3 steps
- Rogowski measuring coil with Ø 300 mm
- Plug & Play: via USB without additional power supply
| File | Size |
|---|---|
| Brochures » LC | |
| EPA_DiffDi_Differential_Current_Diagnosis_Brochure.pdf | 7.12 M |
| Software » LC | |
| EPA-DiffDi-Soft_V2.4.1.0.zip | 0.96 G |
| EPA-DiffDi-Soft_V3.2.1.0.zip | 697.99 M |
In detail
One of the most common causes for motor failures is, that their bearings were damaged by bearing currents. However, as bearing currents are physically very difficult and almost impossible to measure on site, they can only be effectively recorded using the residual current measurement method.
Using the DiffDi® diagnostic system, it is possible to quickly and easily record, analyze and evaluate high-frequency residual currents and their effects on inverter-driven motors.
Preparation
After a short menu-guided software and device driver installation under Windows, the currents in the kHz to MHz range are recorded on the motor side via the measuring device. The application is simple: The Rogowski measuring coil is placed around the three motor phases – it is not necessary to disconnect the current path.
After starting the software, the motor data should be entered. This is used to determine the recommended maximum current load in relation to the motor to be measured. The maximum recommended current load is marked in red in the graphs in the measurements.
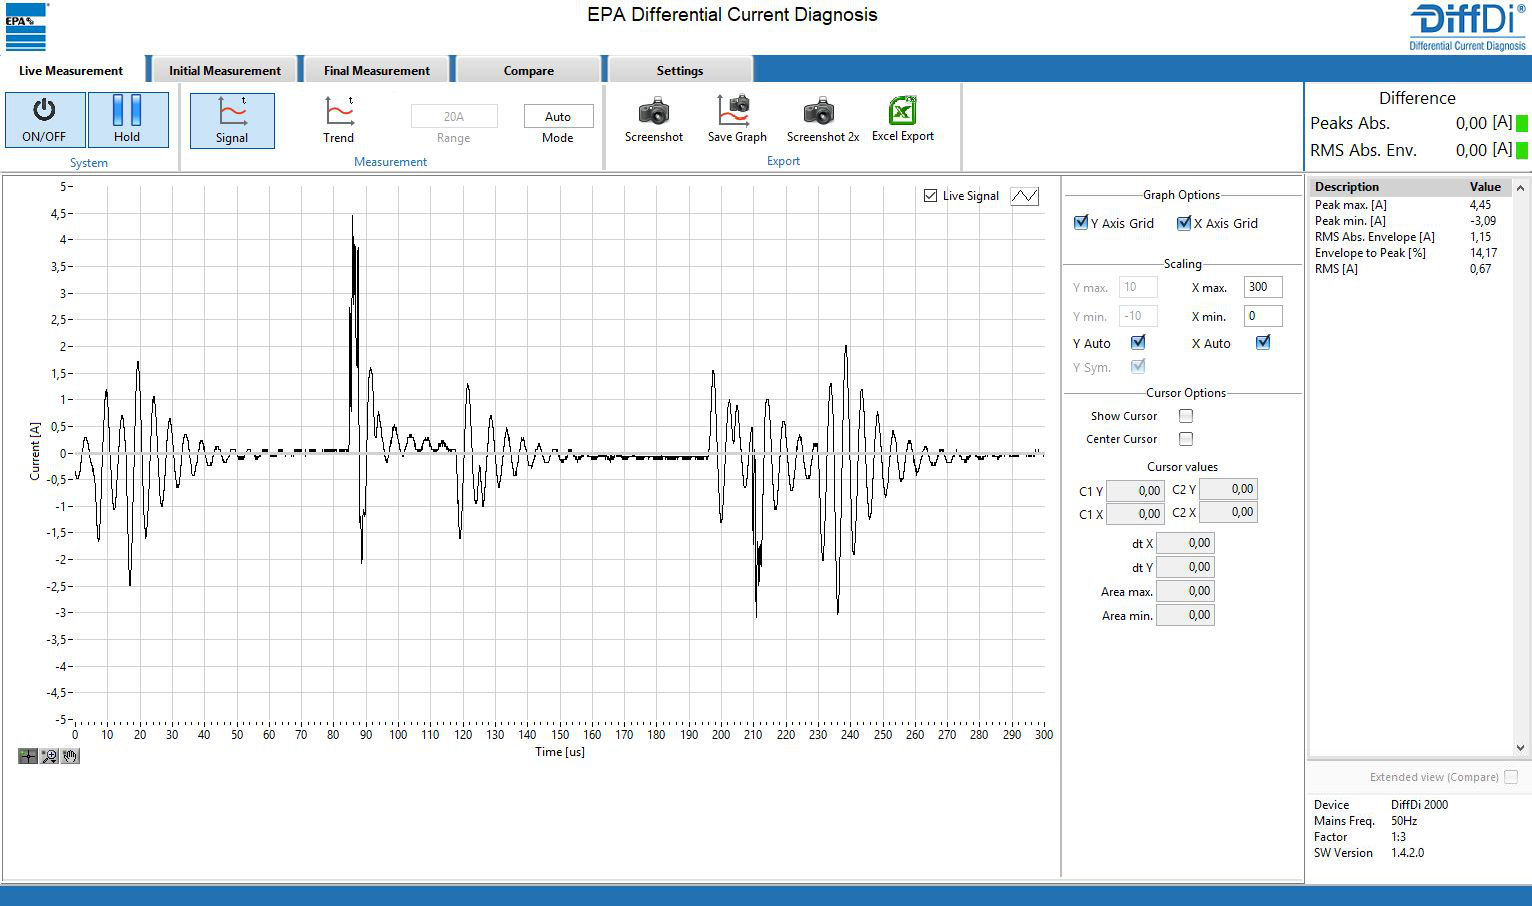
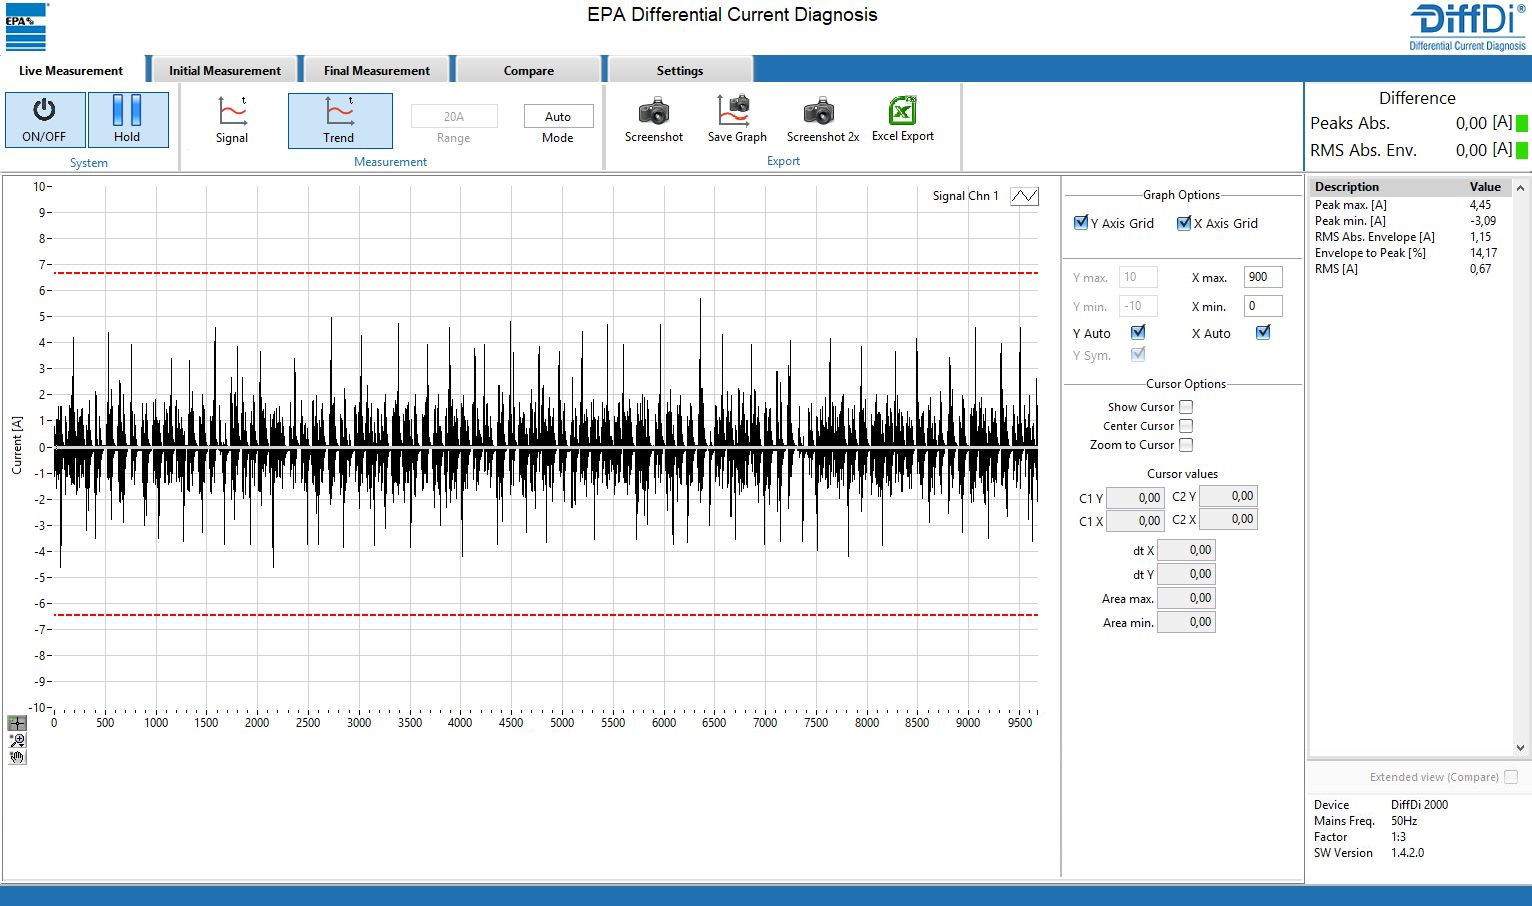
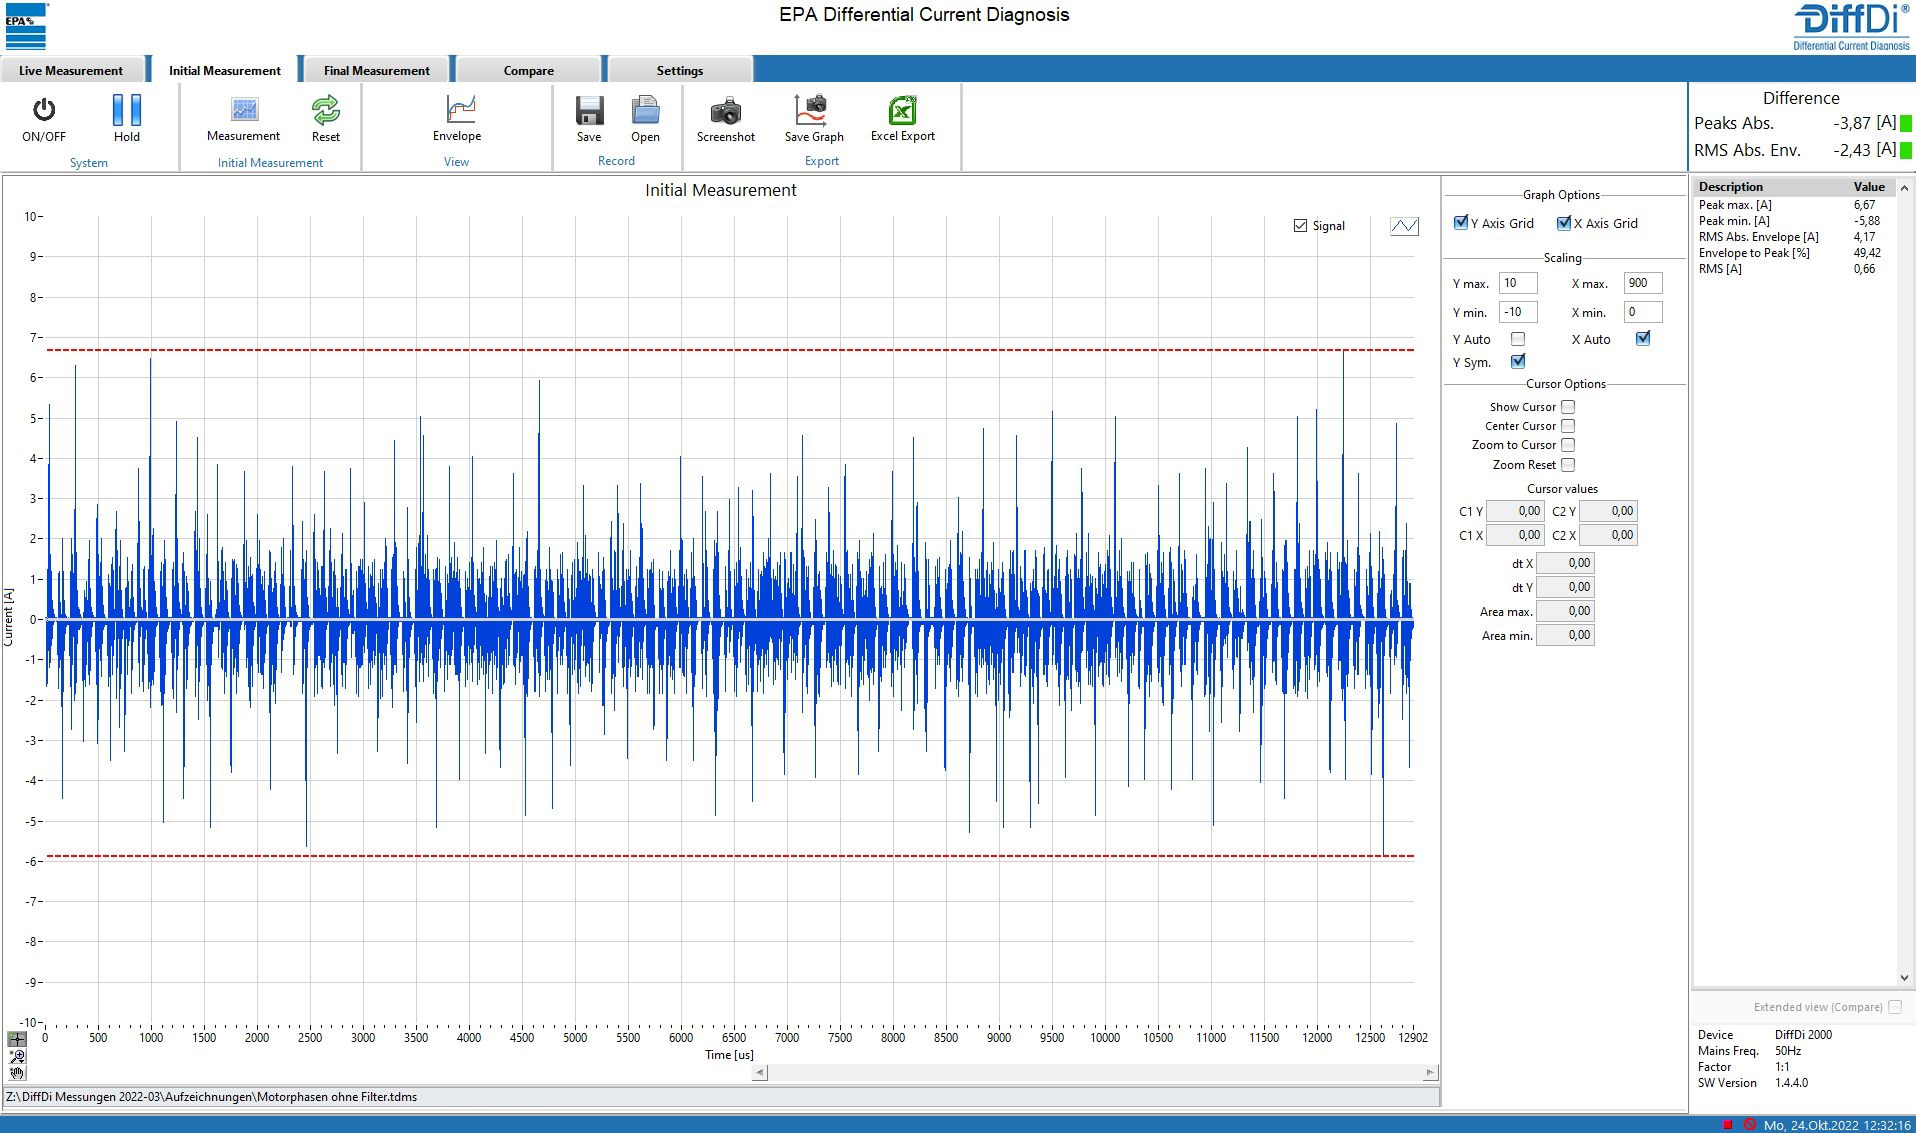
Record the current state
In the first step of the measurement, the actual state of the machine is recorded. The specially developed DiffDi®-Soft software enables snapshots of the high-frequency currents present in the drive system. (Peak) values can be analyzed, evaluated and documented. The selection of a motor filter for step two, for example, is based on the previously obtained data.
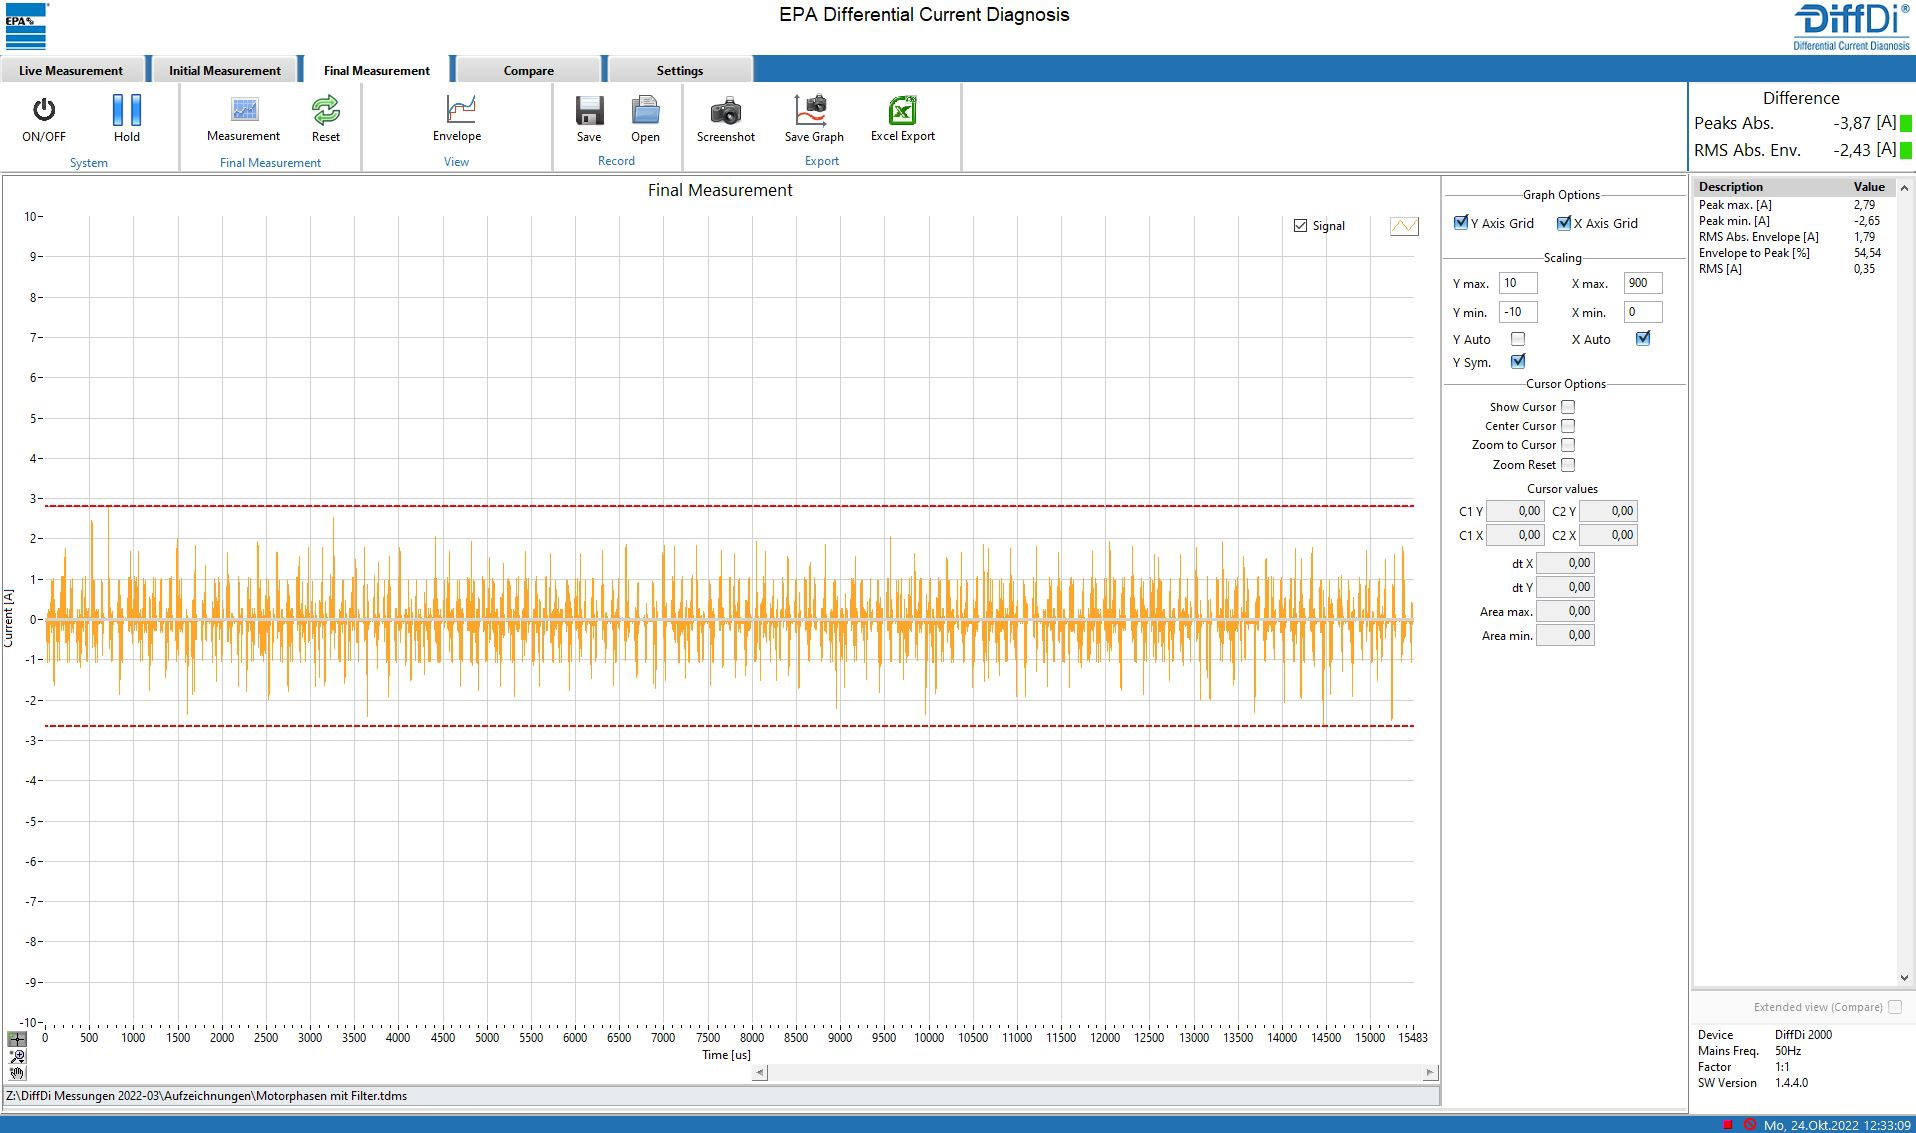
Measures and control
Once the filter measure has been installed, step one is repeated and the effect of the method is measured.
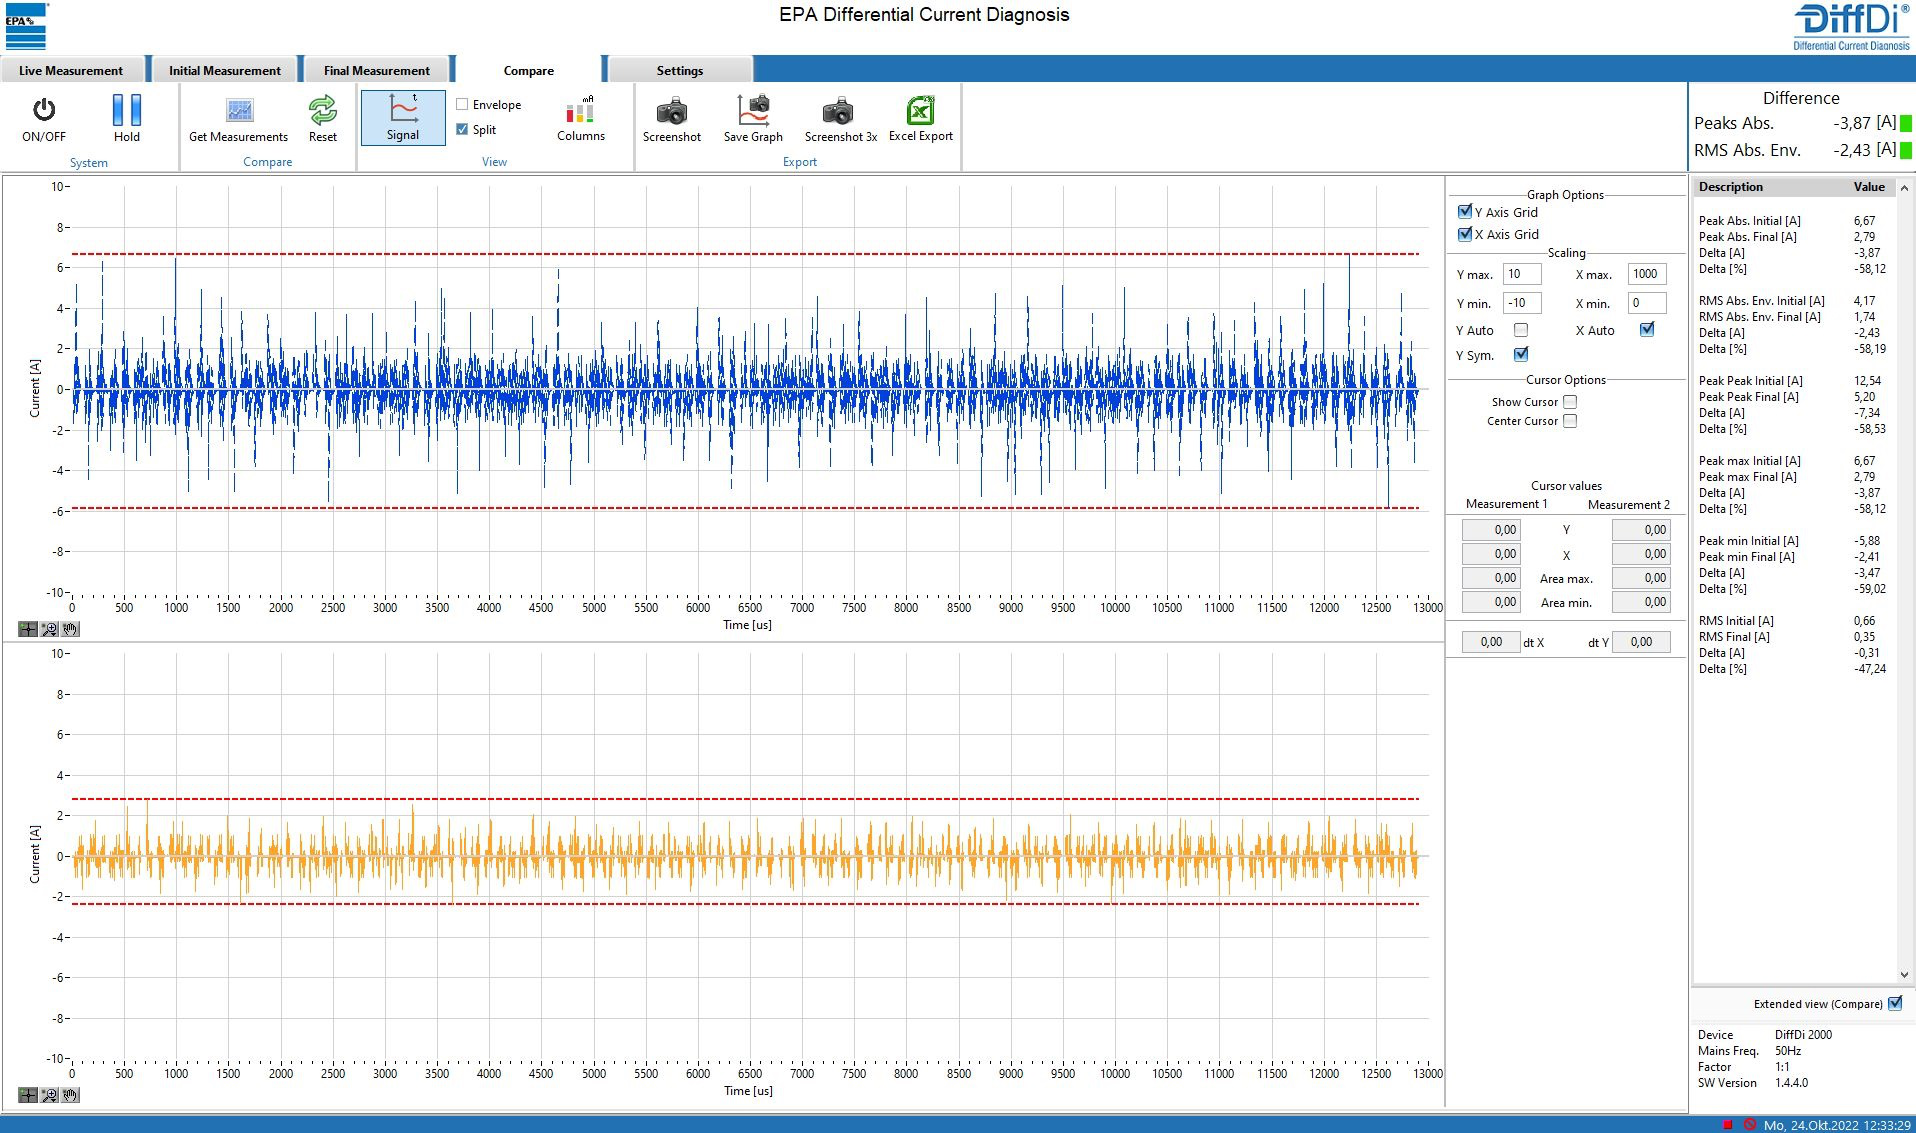
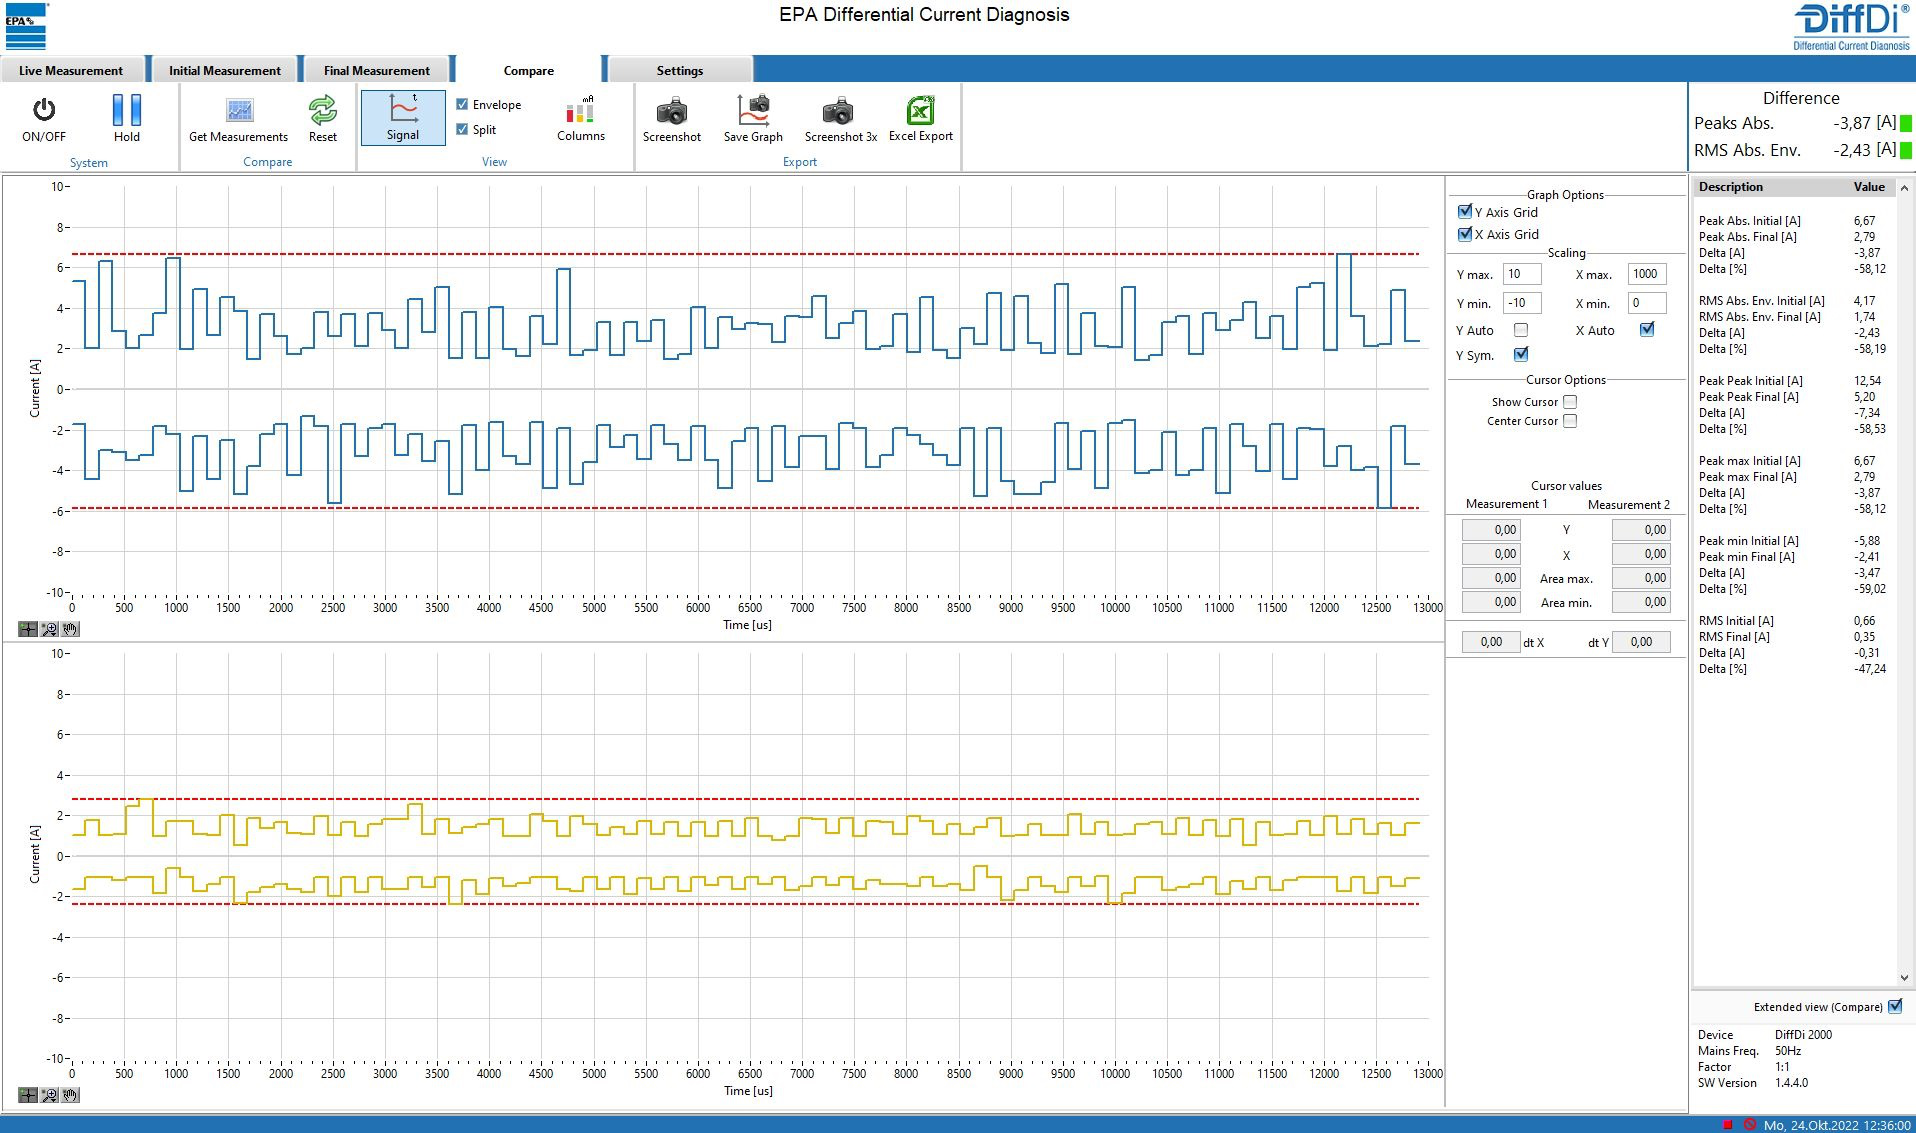
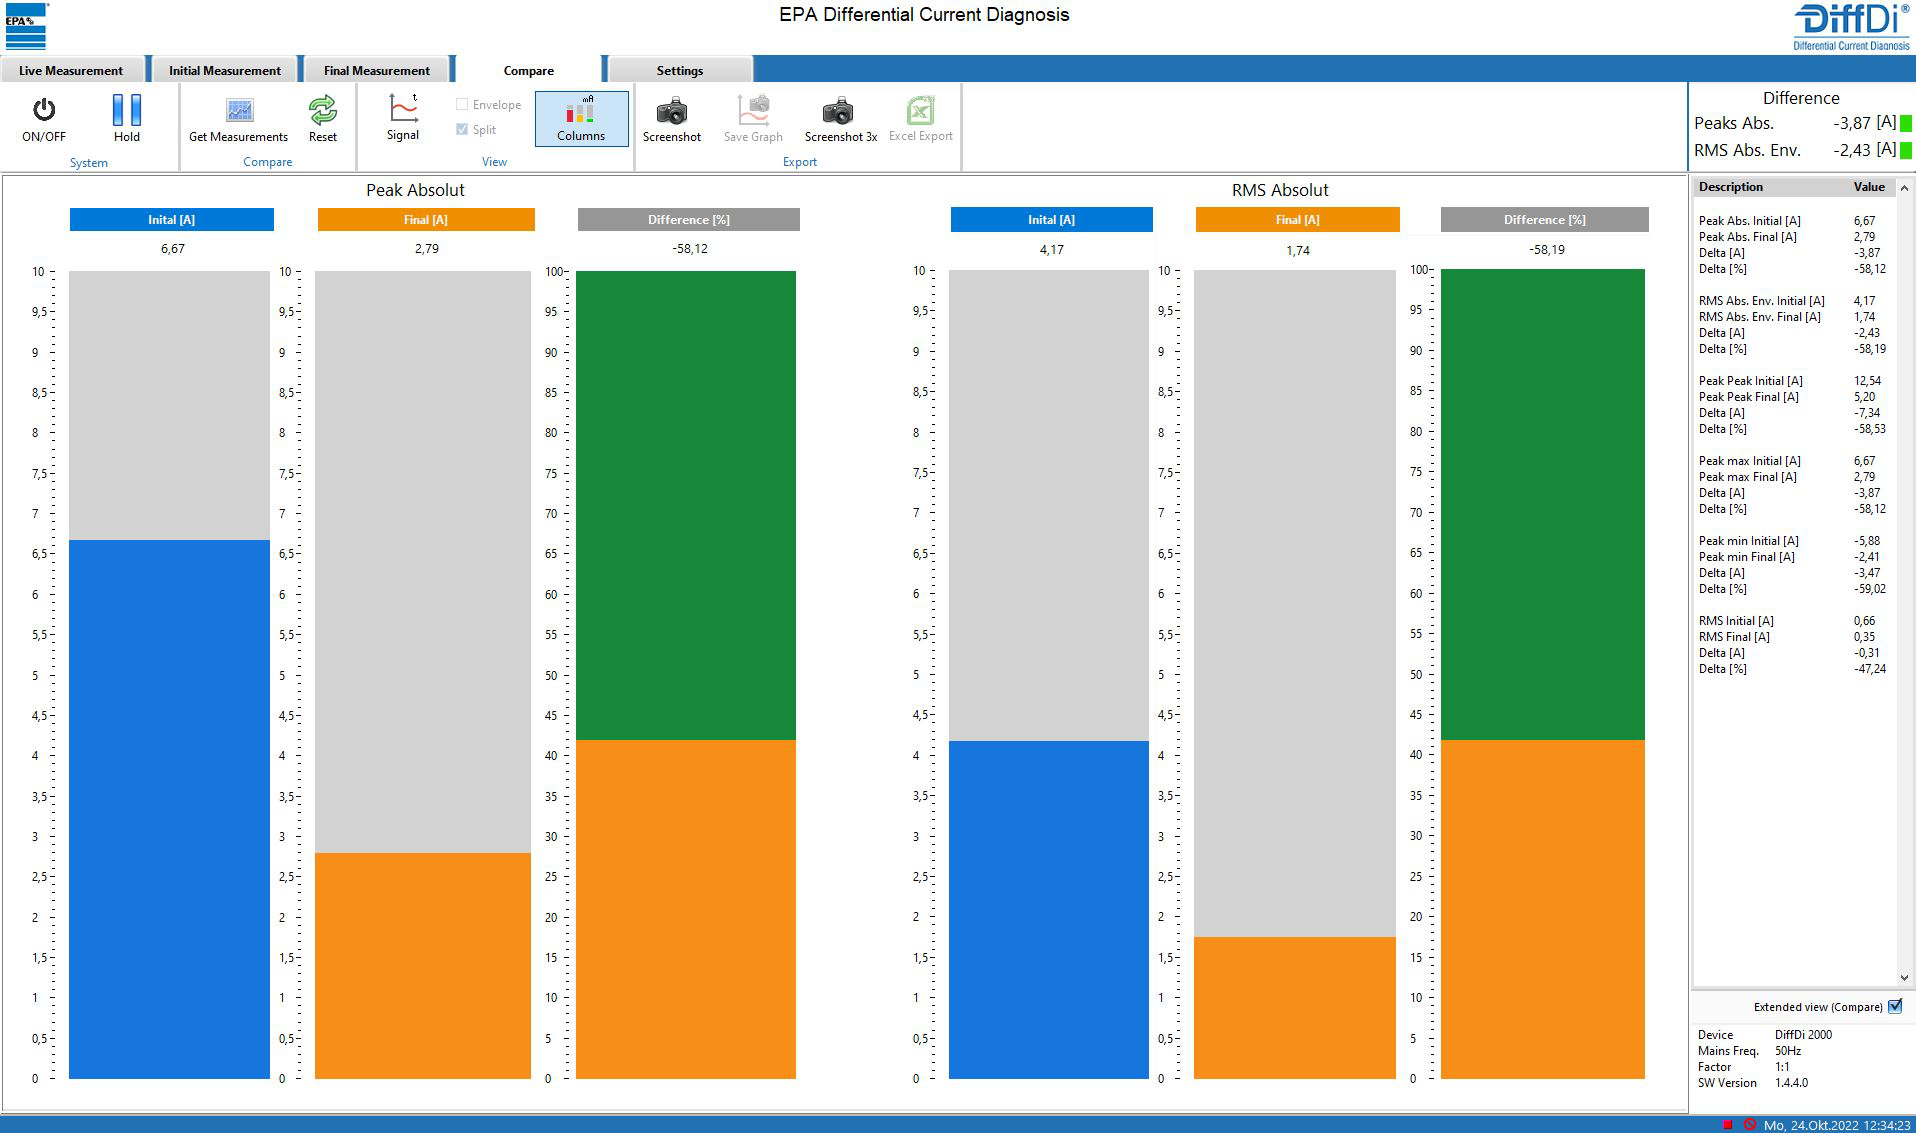
In the final step, the recorded measurements 1 and 2 can be compared at the touch of a button. This allows the recorded time periods to be compared and analyzed. A before and after analysis of the measured values provides important information about the effectiveness of the EMC / filter measures taken, such as the reduction of residual currents.
Also available for rental!
Rent, measure and see for yourself. Just ask us!
Screenshots DiffDi®-Soft